
DxSuite
DxManage™Active
Digital Asset Management
DxPro™Active
EPC Capital Project Management
DxWorks™Active
Digital O&M Mobile Platform
DxMonitor™Active
Asset & Workforce Monitoring
DxBilling™Active
Utility Pre-paid Billing Engine
DxSuite
A unified platform for portfolio-scale renewable energy monitoring, analytics, and digital O&M — powered by AI, Time Series Historian, and an integrated mobile CMMS. From single-site dashboards to multi-country fleet views, DxMonitor™ turns operational data into revenue-protecting insight.
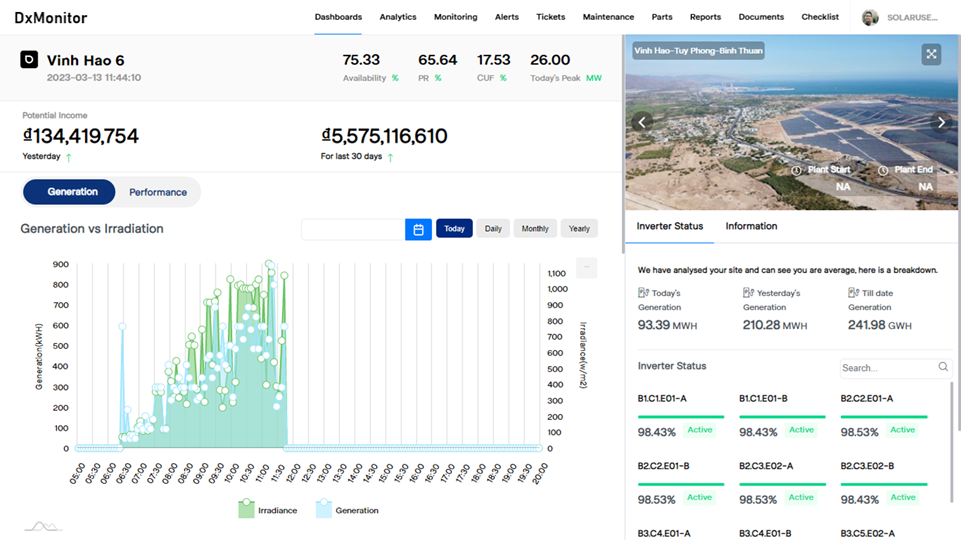
Pyranometer · Inverter · String · Analytics
End-to-end monitoring and analytics for utility-scale and distributed solar — from irradiance sensor to energy meter. DxMonitor™ correlates generation with irradiance in real time, detects underperformance through AI outlier models, and quantifies losses across the full solar loss waterfall.
Live telemetry from Pyranometers, Inverters, and Strings with per-device dashboards showing generation vs irradiation, availability, and PR.
AI models flag underperforming inverters and strings by comparing actual vs expected generation — catching soiling, shading, and faults early.
Decompose energy losses from irradiance to meter export — quantifying clipping, downtime, soiling, and system losses in a cascading model.
Trend analysis on I-V curves, CUF, PR, and efficiency ratios at inverter and string level for targeted O&M decisions.
Integrated corrective and preventive maintenance with mobile work orders, permit-to-work, spare parts inventory, and HSE — all linked to monitoring events.
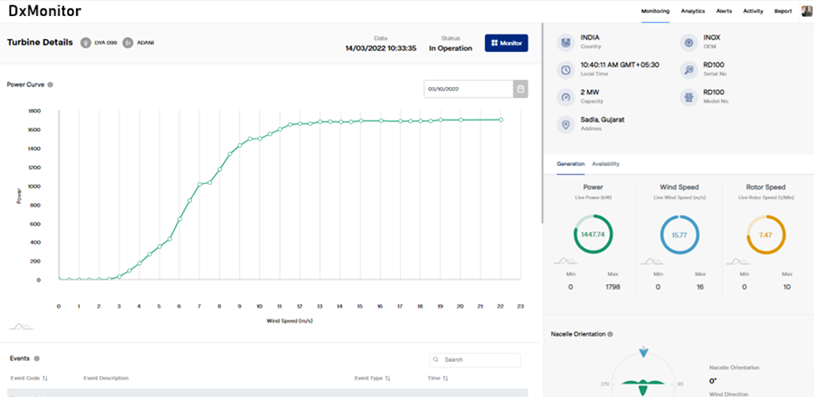
Turbine · Power Curve · Timeline · Loss Model
Fleet-level and turbine-level monitoring for onshore and offshore wind — ingesting SCADA data to deliver real-time power, availability, and alarm dashboards. Power curve benchmarking, 24-hour status timelines, and loss attribution give O&M teams the intelligence to maximise AEP.
Live SCADA feed for every turbine — active power, rotor speed, nacelle orientation, wind speed, and generator temperatures on a fleet or single-turbine view.
Plot actual vs OEM reference power curve per turbine, detect performance degradation, and benchmark across the fleet to identify outliers for targeted action.
Visual timeline of each turbine's status — running, curtailed, faulted, maintenance — enabling precise availability and lost-generation calculation.
Attribute lost generation to curtailment, faults, maintenance, grid constraints, and low-wind — avoidable vs unavoidable losses clearly decomposed.
Fault-triggered corrective work orders, scheduled PM plans, climb permits, safety observations, and technician mobile app — fully integrated with the turbine monitoring layer.
Stacked supply sources (solar + battery discharge + grid import) that together serve the site load. The Site Load line is the sum of all supply — it always traces the top of the stack. Grid import fills the gap when solar + storage fall short.
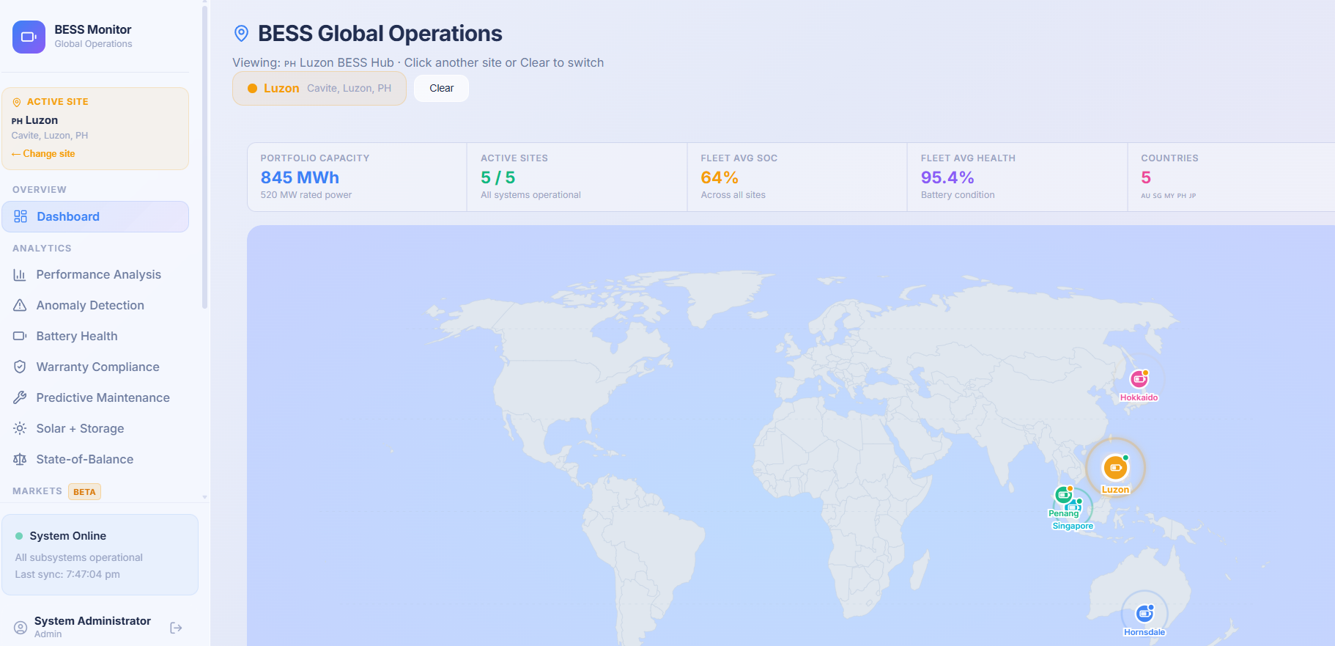
SoC · SoH · Anomaly Detection · Predictive Maintenance
Portfolio-scale battery monitoring across multiple countries and chemistries — tracking SoC, SoH, cell telemetry, and BMS alarms in real time. AI-powered anomaly detection and degradation modelling protect asset value and extend battery life beyond warranted expectations.
Continuous monitoring of SoC, SoH, cell voltage, temperature, current, and BMS alarms across all rack and module levels.
Track capacity fade, impedance growth, and cycle counts — with degradation curves and warranty compliance reporting against OEM guarantees.
AI models detect thermal anomalies, cell imbalance, and unusual charge/discharge patterns before they escalate — reducing unplanned outages and safety events.
Remaining useful life modelling at cell and string level enables condition-based scheduling, reducing unnecessary inspections and extending asset life.
Integrated maintenance workflows for BESS — preventive inspections, corrective faults from telemetry alerts, spare battery module tracking, and HSE permit-to-work.
Book a 30-minute live walkthrough — we'll show DxMonitor™ running with your asset type, data sources, and KPI targets.